tharwan.de

Some Words About Physics, Python And The World In General

How much storage does the "Energiewende" need?

A lot.

Since storage is one of the central themes when people are talking about the transition to renewable power, you might have been wondering how much storage do we need. And as many question it has no easy answer, except: "it depends.". It is not easy to find some rough estimates on the web. And where I did, there was no methodology attached to understand their validity. Of course, there are scientific studies but their are hard to access and understand. So I set out to do some, simple as possible, analysis myself. You can find the complete calculations here.

Worst case: 25TWh

Let‘s start straight with the big numbers. Of course, without a reference almost nobody knows if 25TWh is big or not. So lets put them into perspective. Germany currently has about 30 pumped hydro reservoirs. Together they add up to 0.0377 TWh of storage. Which gives us a first glimpse of how much 25TWh are, Germany would need 650x as many pumped hydro installations as it currently has.

Everybody is talking about battery storage these days. So how would li-ion batteries do? Let‘s see: the Tesla Model S is available with 0.1 MWh of storage. This means we would need about 250,000,000 Model S batteries. For comparison there are currently about 43,000,000 cars Germany.

But battery production is picking up quickly around the world. So how long would it take to produce as many as we need? With current battery production output, 880 years. With the estimated output for 2020 only about 140 years. Even if production doubles three more times this is still almost 20 years for Germany‘s storage alone.

Why would we need so much?

The "worst case" would be if we would scale up Germany's current production from wind and solar so that it would just about meet the yearly power consumption. There is no exchange though the power grid with other countries. In this case one would need to store every single kWh that is not used right away to provide for the times when not enough wind is blowing or sun is shining. This would look like the following (data with 15 minute resolution):

2016

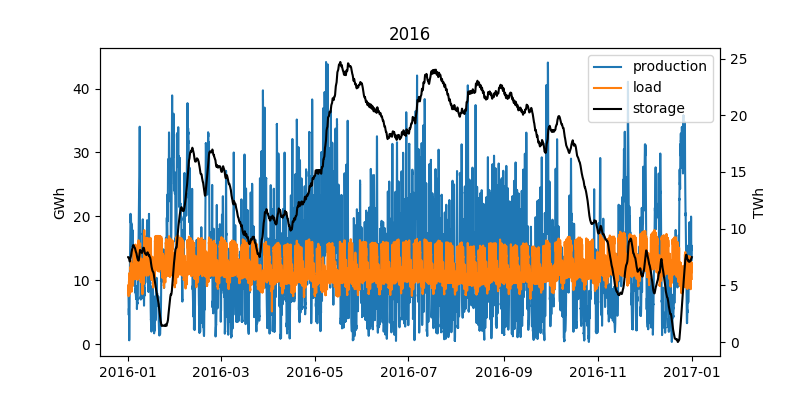
We notice two important things in here:

  1. storage fills up during the summer, and is almost drained during autumn
  2. the level in the storage is the same in the beginning and the end of the year

While the second thing is just part of the methodology and you can read more about it in the detailed version of this article, the first one is worth discussing. If we look in detail at the October-November time frame, we can see how there is almost constant underproduction for 4 weeks:

Nov

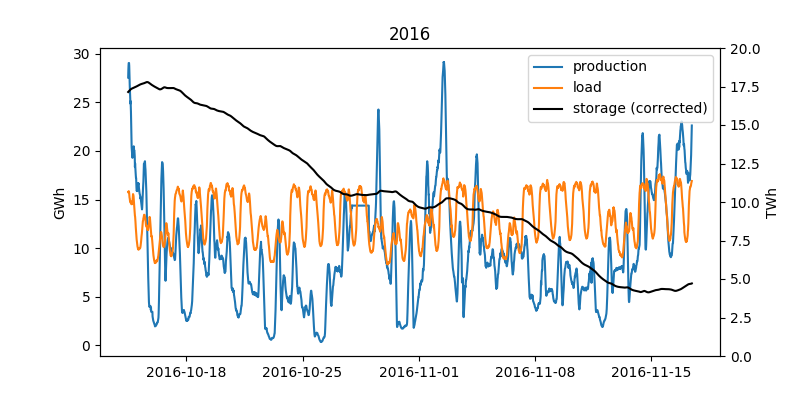
Therefore these four weeks have a big influence on the overall storage need. Yet we can also see, that production is not zero during these weeks. Therefore if we were to scale up production capacities so that we would produce even more power than we actually need, we would most likely save on storage. It is also important to point out that if we relax our assumption of a 100% renewable system, the storage need can be dramatically decreased by filling the gap during these 4 weeks with fossil fuels.

Production over-capacities will save on storage

This is indeed the case. The first thing we have to realize however is, how far away Germany still is from producing enough electric power from renewables during one year and consequently even further from having over-production. To collect enough power with renewables to fulfill the yearly consumption Germany would need to upscale its current installation by a factor of 4. So 4 times as many solar installations and 4 times as many wind turbines assuming no big changes in efficiency. Of course to achieve over-production even more. It is important to not confuse this with the situation that can already happen, where there is a short term over-production from renewables, and for a few hours they produce more than is needed. In the yearly sum they still only contribute about 25%. That is keeping in mind that we are only looking at the electricity needs here, therefore excluding heating and transport to a large extend.

Over

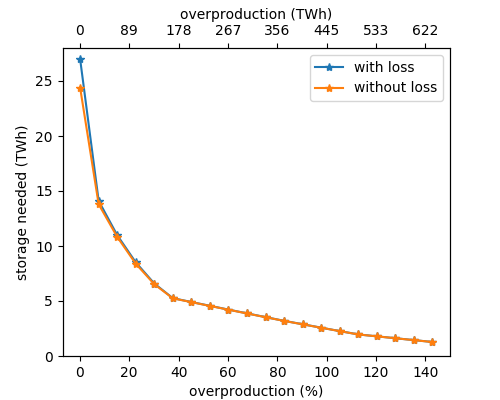
The above graphic shows the effects of overproduction on the storage need. As we can see the need for storage decreases, the more renewables are installed. Furthermore we see the quite massive amounts of energy that would be overproduced during the course of the year. It needs to be pointed out that this analysis is done in the most simple way, so it does not take into consideration physical constraints about how renewables could be upscaled locally or if their power can be transported with the power grid to where it is needed. But again, the purpose of this exercise is just to get some rough idea about the size of the problem.

So if Germany would manage to produce about 100TWh more than it really needs, the storage would reduce to only 6TWh. While this is still a massive storage (about 60,000,000 Tesla Model S batteries or 35 years of world battery output in 2020) it is only a quarter of the worst case estimate. The interesting thing about this scenario of course is the fact that if essentially produces "free energy".

The case for the smart appliances

However before we dream of what to do with this free energy, there is one more thing that can can be estimated: how much can smart appliances contribute to reduce the storage need. For example if we would use our dishwasher in those minutes when the sun is shining or heat our water when the wind is blowing. For this we assume that the smart appliances will follow the availability of renewable power perfectly, in other words they shift their power usage to not consume during times of low wind and solar availability and vice versa. To simulate this, we can just aggregate our data on a daily basis, so instead of looking at an hourly mismatch between production and consumption we just look at the daily mismatch. So we implicitly assume almost perfect management of the flexible demand (like a smart dishwasher or storage heating). If we then compare the storage need for these daily aggregated data to the previous results, we see how much smart appliances and demand response could save on storage in the best case.

Smart

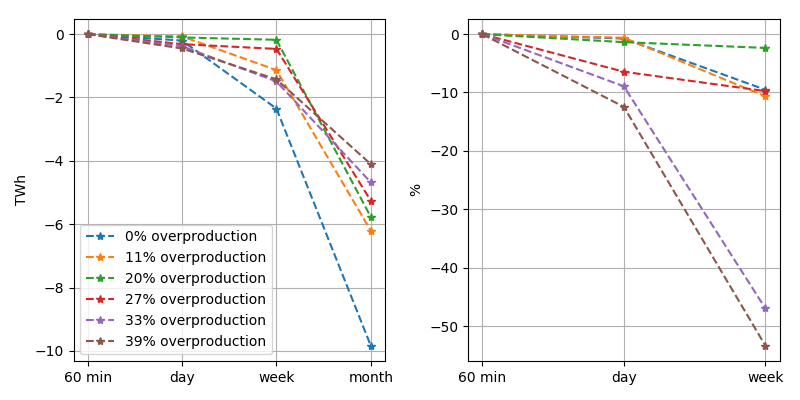
The above graph shows not only the numbers for daily aggregation but also for weeks and month. The important take away however is the following:

It might be possible that flexible demand will play a bigger role during the transition period, where storage is very rare, but overall its role is limited.

Takeaways

Even though li-ion batteries have come a long way, the energy transition will most likely need other means of storage to become reality.

How much storage does the "Energiewende" need? Roughly?

To get some rought estimates we will at first decide to ignore a few things outright:

  1. that Germany is not alone but part of a European wide grid
  2. Sectorcoupling, i.e. that you can store energy in form of heat, or switch your heating between electric power and burning fossile fuels directly

There are much more sophisticated tools which include these like: PyPSA

Our data source is transparency.entsoe.eu (be sure to select country not bidding zone which is the default) where you can download the data once you created an account. We use the data for load and production for all of 2016. The data comes in 15min time resolution. This Jupyter notebook can also be accessed here.

In [1]:
%matplotlib notebook
import numpy as np
import pandas
import matplotlib.pylab as plt
import datetime
import warnings
In [2]:
#setup a date parser so we can aggregate the data later
dateparse = lambda x: pandas.datetime.strptime(x[:16], '%d.%m.%Y %H:%M')  

#import data with pandas
load = pandas.read_csv("Total Load - Day Ahead - Actual_201601010000-201701010000.csv",
                       parse_dates=[0],date_parser=dateparse,index_col=0)
generation = pandas.read_csv("Actual Generation per Production Type_201601010000-201701010000.csv",
                       parse_dates=[1],date_parser=dateparse,index_col=1)

We will make another assumption concerning power from biomass. Not only does it appear the growth period for biomass in Germany is over, there are also good reasons to not push it any further. In essence, their efficiency is below those of wind and solar, and its use needs to be limited in order to be sustainable.

We will therefore include the generation from biomass into the load, which we assume stays constant over all calculations, while we will scale the production (e.g. wind and solar) up to different values.

In [3]:
#print(generation.columns)

wind_year = generation.filter(regex="Wind.*Actual Aggregated.*").sum().sum()
solar_year = generation.filter(regex="Solar.*Actual Aggregated.*").sum().sum()
bio_year = generation.filter(regex="Biomass.*Actual Aggregated.*").sum().sum()
other_renew = generation.filter(regex="(Waste|Geothermal|Marine|renewable|Hydro Run|Hydro Water).*Actual Aggregated.*").sum().sum()
fossile = generation.filter(regex="(Fossil|Nuclear).*Actual Aggregated.*").sum().sum()


tmp = np.array([wind_year,solar_year,bio_year,other_renew,fossile])/1E6*0.25
labels = ["wind","solar","bio","other","fossile+nuclear"]
plt.figure(figsize=(6,2))
ax = plt.subplot()
left = 0
for idx in range(len(tmp)):
    plt.barh(0,tmp[idx],1,left,label=labels[idx])
    left += tmp[idx]
plt.legend(loc=7)
plt.tight_layout()
plt.xlim((0,450))
ax.set_yticklabels(())
ax.set_yticks(())
Out[3]:
[]
In [4]:
# next we grab the parts that we acually need
# there are some nans in the data mostly because of winter/summer time changes, 
# we fill all missing values from both sides

prod_15_df = generation["Wind Offshore  - Actual Aggregated [MW]"].fillna(method='ffill')
prod_15_df += generation["Wind Onshore  - Actual Aggregated [MW]"].fillna(method='ffill')
prod_15_df += generation["Solar  - Actual Aggregated [MW]"].fillna(method='ffill')

# we also convert the data to MWh, since we have the average for every 15min we just multiply by 1/4 h, 
# e.g. x MW * 0.25 h -> MWh
prod_15_df *= 0.25
prod_15 = prod_15_df.values


load_15_df = load["Actual Total Load [MW] - Germany (DE)"].fillna(method="ffill")
# the biomass production gets subtracted from the load as we assume it stays constant
load_15_df -= generation["Biomass  - Actual Aggregated [MW]"].fillna(method='ffill')
other_renew = generation.filter(regex="(Waste|Geothermal|renewable|Hydro Run|Hydro Water).*Actual Aggregated.*")
for col in other_renew.columns:
    print(col)
    load_15_df -= generation[col].fillna(method="ffill")
load_15_df *= 0.25
load_15 = load_15_df.values
Geothermal  - Actual Aggregated [MW]
Hydro Run-of-river and poundage  - Actual Aggregated [MW]
Hydro Water Reservoir  - Actual Aggregated [MW]
Other renewable  - Actual Aggregated [MW]
Waste  - Actual Aggregated [MW]

How much do renewables contribute?

The data set also contains data for other renewable energy production, which are quite minor in Germany. The first thing to do now is to scale up the production of solar and wind so that it will match the yearly energy consumption.

In [5]:
scale = np.sum(load_15)/np.sum(prod_15)
print("yearly load {:.2f}TWh\nyear's renewable production {:.2f}TWh".format(np.sum(load_15)/1E6,np.sum(prod_15)/1E6))
print("upscaling factor: {:.2f}".format(scale))
prod_fit = prod_15 * scale
yearly load 423.55TWh
year's renewable production 111.27TWh
upscaling factor: 3.81

As we can see, we need about 4x as many renewables than what is currently installed in Germany, just provide enough electricity as is needed during one year. We more or less already knew that, since renewables only account for 1/4 to 1/5 of Germany electricity supply.

Before we have a look at the data, there is one more thing to point out, as there seems to be a bit of a mismatch between the numbers here and, for example, the data on this wikipedia page or this German one, that all list different number for the overall electricity consumption in 2016.

I assume that the numbers in this data here concern only the electricity which was traded via the spot market, while other data may also contain other long term contracts. Whatever may be the case, for a rough number it should be good.

So let's have a look at the data:

In [6]:
fig = plt.figure(figsize=(8,4))
ax1 = plt.subplot()
x = generation.index
ax1.plot(x,prod_fit/1E3,label="production")
ax1.plot(x,load_15/1E3,label="load")
ax1.set_ylabel("GWh")
plt.legend()
plt.grid()
plt.title("2016")
plt.tight_layout()

As we might expect, we see a very constant and somewhat predictable load curve, while production varies wildly.

In [7]:
fig = plt.figure(figsize=(8,4))
ax1 = plt.subplot()
x = generation.index
start = 1500
stop = start + 14*24*4
ax1.plot(x[start:stop],prod_fit[start:stop]/1E3,label="production")
ax1.plot(x[start:stop],load_15[start:stop]/1E3,label="load")
ax1.set_ylabel("GWh")
plt.legend()
plt.grid()
plt.title("2016")
plt.ylim((0,36))
plt.tight_layout()

If we zoom in on these two weeks in January, we can see one of the major problems to face already. During the first week we have almost constantly too little production, while in the second week we have excess production for most of the time. So we need to store the energy not only for a few hours (from mid day to provide light during the evening, for example), but for at least a full week.

So let's calculate how much we will store or draw from storage. We will ignore any losses at first, just for some very simple approximations. We just calculate the difference between production and consumption at any point in time:

$$D_t = P_t - C_t$$

We can then sum up this difference over time, which will give us the storage level at any point:

$$S_t = \sum_{i=0}^t P_i - C_i$$

Since we set $\sum_T P_t = \sum_T C_t$ we know that $S_t$ will be 0 for $t = T$ or, in other words, we will end with the same level in the storage as we begun. However, we might run below zero during the course of the year. To correct for that we just subtract the minumum point afterwards, as you will see.

In [48]:
diff_15 = prod_fit - load_15  #our D_t
storage_15 = np.cumsum(diff_15)  #S_t

plt.figure(figsize=(8,4))
x = generation.index
ax1 = plt.subplot()
lines = ax1.plot(x,prod_fit/1E3,label="production")
lines += ax1.plot(x,load_15/1E3,label="load")

ax1.set_ylabel("GWh")

ax2 = ax1.twinx()
#lines += ax2.plot(x,(storage_15)/1E6,'k--',label="storage")
lines += ax2.plot(x,(storage_15-min(storage_15))/1E6,'k',label="storage")
ax2.set_ylabel("TWh")
labels = [l.get_label() for l in lines]
plt.legend(lines,labels)
plt.title("2016")

plt.tight_layout()

It is important to note that we changed the scale of the storage axis (from GWh to TWh!), as otherwise we could not see anything.

So let's zoom in again into the two weeks of January.

In [47]:
plt.figure(figsize=(8,4))
x = generation.index
start = 1500
stop = start + 14*24*4

ax1 = plt.subplot()
lines = ax1.plot(x[start:stop],prod_fit[start:stop]/1E3,label="production")
lines += ax1.plot(x[start:stop],load_15[start:stop]/1E3,label="load")

ax1.set_ylabel("GWh")
ax2.set_ylim((0,36))

ax2 = ax1.twinx()
#lines += ax2.plot(x,(storage_15)/1E6,'k--',label="storage")
lines += ax2.plot(x[start:stop],(storage_15[start:stop]-min(storage_15))/1E6,'k',label="storage")
ax2.set_ylabel("TWh")
ax2.set_ylim((0,8))
labels = [l.get_label() for l in lines]
plt.legend(lines,labels,loc=9)
plt.title("2016")

plt.tight_layout()

As we would expect, storage gets drained during the first week and filled up again in the second. You might be wondering if the storage needed would change if we would include the beginning of the next and the end of the last year. Indeed we leave the storage the same way we found, however if the following year would require a higher starting level it would indeed change the outcome. However since we already analyzed a full year and each year is at least somewhat similar due to the seasons, including another week or minth should not change much about the estimation. The data is also available, so the analysis can be done, but for an estimate it‘s not really needed.

But how much storage do we need now?

In [26]:
storage_needed_15 = (np.max(storage_15)-np.min(storage_15))
print("storage needed {:.2f} TWh".format(storage_needed_15/1E6 ))
storage needed 22.98 TWh

Well ok 23 TWh, but how much is that?

Let's see: we can compare it to pumped hydro storage

In [27]:
current_hydro = 37700  #MWh in Germany from Wikipedia
print("current pumped hydro: {} TWh\nupscale factor: {:.0f}".format(current_hydro/1E6,storage_needed_15/current_hydro))
current pumped hydro: 0.0377 TWh
upscale factor: 610

Ok, so we need more than 600x as much hydro as we currently have. So that does not seem like a good strategy.

What about Batteries?

Li-Ion batteries are all the rage these days, so why don‘t we use some of them? Lets see how many we would need.

In [28]:
tesla_model_s = 0.1  #MWh
tesla_power_wall = 0.013 #MWh
tesla_power_pack = 0.2 #MWh
print("{:13,.0f} Model S batteries or\n{:13,.0f} power walls or\n{:13,.0f} power packs.".format(
    storage_needed_15/tesla_model_s,storage_needed_15/tesla_power_wall,storage_needed_15/tesla_power_pack))
  229,833,410 Model S batteries or
1,767,949,310 power walls or
  114,916,705 power packs.

So if we compare this with some of the well known Tesla products that use batteries we still find we a need a lot. In fact there are currently only about 43,000,000 cars in Germany. So even even they would all be Teslas and not used for driving, we would still need 4x as many cars.

Ok, but the production of batteries is picking up quickly around the world. So at least it should not take too long to make the batteries we need?

In [29]:
battery_production_2016 = 28E3 # 28 gigawatt-hours
battery_production_2020 = 174E3 # 174 gigawatt-hours
print("With 2016 output it takes about {:.0f} years of battery production.".format(storage_needed_15/battery_production_2016))
print("With estimated 2020 output {:.0f} years.".format(storage_needed_15/battery_production_2020))
With 2016 output it takes about 821 years of battery production.
With estimated 2020 output 132 years.

That is too long, even if production doubles a few more times it takes at least 20 years and that would be for Germany only. We have too look into the details a bit more.

Why do we even need so much?

In [43]:
plt.figure(figsize=(8,4))
x = generation.index
start = 27600
stop = start + 34*24*4

ax1 = plt.subplot()
lines = ax1.plot(x[start:stop],prod_fit[start:stop]/1E3,label="production")
lines += ax1.plot(x[start:stop],load_15[start:stop]/1E3,label="load")

ax1.set_ylabel("GWh")
ax2.set_ylim((0,36))

ax2 = ax1.twinx()
#lines += ax2.plot(x,(storage_15)/1E6,'k--',label="storage")
lines += ax2.plot(x[start:stop],(storage_15[start:stop]-min(storage_15))/1E6,'k',label="storage (corrected)")
ax2.set_ylabel("TWh")
ax2.set_ylim((0,20))
labels = [l.get_label() for l in lines]
plt.legend(lines,labels)
plt.title("2016")

plt.tight_layout()

If we look at the first plot showing the storage usage during the whole year, we can see how our storage gets filled during the summer months and then drains rapidly during autumn. As we can see in the above figure, from the middle of October till the middle of November we have almost constant under production. So much so that we would have drained almost 3/4 of our storage. These four weeks are the main reason we need so much storage.

How to reduce the storage need?

Nevertheless, we are not underproducing all that much on most of the days. So what we could do is not just build as many renewables as we absolutely need, but just a few more. This will however complicate the storage calculation a bit.

What we have to do now is not just sum up the differences, as this would just fill our storage more and more. Instead we have to work our way backwards thought the year. For each timestep we check how much we over- or underproduced. If we have underproduction we add it to our storage need, since we now that this under production needs to be taken from storage which has to be filled in the days before. Then we look at the next time step which, since we are going backwards, is in fact the one before the current one. If we had over production in this time step, we can subtract it from you storage need until the storage need is 0. If we had underproduction in this timestep too we just add it to the storage need. We also keep track of the storage need for each time step we visit. This way if we need something from the storage in three consecutive days, we will have a very high storage need calculated in the day before that. But we also keep track of the possibility to refill the storage anytime.

In [31]:
def calc_need(diff):
    need = np.zeros_like(diff)
    state = 0
    for idx,d in enumerate(diff[::-1]):  #we iterate in reverse order
        if state + d > 0:
            need[idx] = 0
            state = 0
        else:
            need[idx] = -state - d
            state += d
    return need[::-1]  #and then reverse the result again
In [32]:
over_scale = 4.5
prod_over = prod_15 * over_scale

diff_over = prod_over - load_15
need = calc_need(diff_over)
storage_need = np.max(need)

print("storage needed {:.2f} TWh".format(storage_need/1E6))
storage needed 9.83 TWh

With only a slight overproduction we already decreased the storage need quite dramatically, to about half of what we needed before.

We can also calculate how our storage level would look like at any given point in time and use it to check if our calculations are correct. We just set the maximum level of storage need we calculated by going backwards though the year as our storage capacity, then fill the storage with any over-production and drain it as needed.

Furthermore, with this kind of backtracking, we can also consider the storage losses that would occour from self-discharge of Li-Ion batteries. We just need to consider that our storage need grows every time we move one timestep. It grows since we are moving backwards through the year and we are keeping track of the storage needs. So during one step forward in time, we would loose some energy, which means if we go backwards we need more capacity.

In [33]:
# Li-Ion batteries loose about 2-3% of charge per month of storage
qHour_in_month = 30*24*4
days_in_month = 30

def calc_need(diff,subs,loss_per_month = 1-0.02):
    loss_per_sub = np.exp(np.log(loss_per_month)/subs)
    need = np.zeros_like(diff)
    state = 0
    for idx,d in enumerate(diff[::-1]):
        if state + d > 0:
            need[idx] = 0
            state = 0
        else:
            state /= loss_per_sub
            need[idx] = -state - d
            state += d
    return need[::-1]

def calc_level(diff,subs,loss_per_month = 1-0.02):
    loss_per_sub = np.exp(np.log(loss_per_month)/subs)
    batt = np.zeros_like(diff)
    tmp = -np.min(np.cumsum(diff))*1.1  # 1.1 as safety margin
    for idx,d in enumerate(diff):
        tmp = min((storage_need,tmp*loss_per_sub+d))
        batt[idx] = tmp
    return batt
In [34]:
need = calc_need(diff_over,qHour_in_month)
storage_need = np.max(need)
level = calc_level(diff_over,qHour_in_month)

x = generation.index
plt.figure(figsize=(8,4))
plt.plot(x,level/1E6,label="level")
plt.plot(x,need/1E6,label="need")
plt.ylabel("TWh")
plt.grid()
plt.legend()
plt.tight_layout()

As we can see, the storage will indeed be fully used during the critical time in November. We also exit the year with an almost full storage.

Let‘s see how much over-capacity reduces storage need

In the next figure we will compare the needed storage depending on how much more renewable capacity we installed then we would absolutly need. We can also use this to see the influence of the storage losses we introduced.

In [36]:
test_values = np.arange(3.9,10,0.3)
storage_need_array = np.zeros_like(test_values)
storage_need_array_nL = np.zeros_like(test_values)
over_production = np.zeros_like(test_values)
over_TWh = np.zeros_like(test_values)

for idx,over_scale in enumerate(test_values):
    prod_over = prod_15 * over_scale
    diff_over = prod_over - load_15

    over_production[idx] = np.sum(diff_over) / np.sum(prod_fit)
    over_TWh[idx] = np.sum(prod_over) - np.sum(load_15)
    #print(np.sum(prod_over)/1E6-np.sum(load_15)/1E6)
    need = calc_need(diff_over,qHour_in_month)
    storage_need_array[idx] = np.max(need)

    need = calc_need(diff_over,qHour_in_month,1)
    storage_need_array_nL[idx] = np.max(need)


plt.figure(figsize=(5,4))
ax1 = plt.subplot()
ax1.plot(over_production*100,storage_need_array/1E6,'*-',label="with loss")
ax2 = ax1.twiny()
ax1.plot(over_production*100,storage_need_array_nL/1E6,'*-',label="without loss")

all_prod = np.sum(prod_fit)
tmp = np.array(ax1.get_xticks())/100*all_prod


ax2.set_xlim(ax1.get_xlim())
ax2.set_xticklabels(["{:.0f}".format(x) for x in tmp/1E6])
plt.ylim((0,25))
ax1.set_ylabel("storage needed (TWh)")
ax2.set_xlabel("overproduction (TWh)")
ax1.set_xlabel("overproduction (%)")
ax1.legend()
Out[36]:
<matplotlib.legend.Legend at 0x1104dff60>

These results actully tells us two things:

  1. Losses only play a big role in the initial scenario, where we produce just as much as we need and, therefore, store energy for longer times;
  2. We have an almost exponential decrease in storage need, which then becomes more linear above 20% over production.

Make no mistake, it might look like an easy option to simply build 5x more renewables instad of just 4x times as much. However, the availability of too much power over long stretches of time might have massive consequences. It might "just" drive up consumption, as it will be cheaper during that time, or it might change the whole energy system. Electricity has been comparably cheap for a long time now, but if the capacity of installed renewables delivers more then we need over long stretches of time, energy will essentially be for free. There still costs attatched to maintainance and investments need to be repaid, but these costs are no longer related to the amount of power produced.

Additionally, once there is "free energy" other less efficient storage methods like power to gas become much more attractive. However, it might be that a lot of this energy might also be exported to other European countries, depending on the weather conditions there.

Either way, there is at least one more question we can explore with this data set. I will at first formulate the question in a more boring way, however, we can interpret the results in a much more exciting manner later on.

So the boring question is:

What is the role of time scales?

Does it matter if we look at the problem of storage on a sub-hourly level or with a montly resolution?

To explore this we will group the data by hours, days, weeks and months, to see how this changes the amount of storage that we need. So instead of looking at the data with 15 minute resolution, we sum it up to 60 minutes, 24 hours and so on.

In [39]:
def storage_time_group(scale):
    storage_need_ts = []

    prod_over = prod_15 * scale
    diff_over = prod_over - load_15

    need = calc_need(diff_over,30*24*4)
    storage_need_ts.append(np.max(need))
    over_production = np.sum(diff_over) / np.sum(prod_over)

    prod_60 = prod_15_df.groupby(pandas.TimeGrouper(freq="h")).sum().values
    load_60 = load_15_df.groupby(pandas.TimeGrouper(freq="h")).sum().values
    prod_60 *= scale
    diff_60 = prod_60 - load_60

    need = calc_need(diff_60,30*24)
    storage_need_ts.append(np.max(need))

    prod_day = prod_15_df.groupby(pandas.TimeGrouper(freq="D")).sum().values
    load_day = load_15_df.groupby(pandas.TimeGrouper(freq="D")).sum().values
    prod_day *= scale
    diff_day = prod_day - load_day

    need = calc_need(diff_day,30)
    storage_need_ts.append(np.max(need))

    prod_week = prod_15_df.groupby(pandas.TimeGrouper(freq="w")).sum().values
    load_week = load_15_df.groupby(pandas.TimeGrouper(freq="w")).sum().values
    prod_week *= scale
    diff_week = prod_week - load_week

    need = calc_need(diff_week,4)
    storage_need_ts.append(np.max(need))

    prod_month = prod_15_df.groupby(pandas.TimeGrouper(freq="M")).sum().values
    load_month = load_15_df.groupby(pandas.TimeGrouper(freq="M")).sum().values
    prod_month *= scale
    diff_month = prod_month - load_month

    need = calc_need(diff_month,1)
    storage_need_ts.append(np.max(need))

    return over_production,np.array(storage_need_ts)

plt.figure()
storage_time_dict = {}
for scale in np.arange(3.9,7,0.5):
    over_prod,res = storage_time_group(scale)
    storage_time_dict[over_prod] = res
    plt.plot(range(len(res)),res/1E6,'*--',label="{:.0f}% overproduction".format(over_prod*100))

plt.xticks(range(len(res)), ["15 min","60 min","day","week","month"])
plt.ylim((0,25))
plt.grid()
plt.ylabel("TWh")
plt.tight_layout()
plt.legend(loc=0)
Out[39]:
<matplotlib.legend.Legend at 0x10f314eb8>

What we see in these results is nothing too surprising, if we look at more coarse time scales, we would need less storage. If we only look at the monthly data, e.g. how much we have produced and consumed during whole Janurary, we might not see that we have a lack of production during the first week and over production during the second. On a first look the only intersting outcome is that there is very little change between quarterhourly, hourly and daily grouping of the data, which tells us we should work with at least daily time resolution.

How much "storage" can we get from smart appliances?

However we can also interpret this data differently. Take for example the daily aggregated data. In this data we do not look anymore if there was enough production for the peak hours in the morning or evening, we just check if there was as much production as consumption for the whole day. This way of ignoring the daily peaks can be thought of as and ideal form of demand response. Since we consume all of the days' energy whenever it is available, consumption perfectly follows production, which is nothing more than demand response at its core.

Therefore, this data can also answer the question of how much the "smart dishwasher" can help us reduce the need for storage by adjusting the time when it cleans the dishes. So let's rearrange things so that we can better see these changes. For that, we will plot just the change of storage need in comparison to the base scenario of 15 minutes resolution:

In [40]:
plt.figure(figsize=(8,4))
best = np.zeros(4)

with np.errstate(divide='ignore'):
    for op,res in storage_time_dict.items():
        plt.subplot(121)
        plt.plot(range(len(res)-1),(res[1:]-res[0])/1E6,'*--',label="{:.0f}% overproduction".format(op*100))
        plt.subplot(122)
        plt.plot(range(len(res)-2),(res[1:-1]-res[0])/res[1:-1]*100,'*--',label="{:.0f}% overproduction".format(op*100))
        best = np.minimum(best,(res[1:]-res[0])/res[1:])

plt.subplot(121)
plt.xticks(range(len(res)-1), ["60 min","day","week","month"])
plt.grid()
plt.ylabel("TWh")

plt.legend(loc=0)

plt.subplot(122)
plt.xticks(range(len(res)-2), ["60 min","day","week"])
plt.grid()
plt.ylabel("%")

plt.tight_layout()
print("biggest decrease for:\ndayliy load shift: {:.2f}%\nweekly load shift: {:.2f}%".format(best[1]*100,best[2]*100) )
biggest decrease for:
dayliy load shift: -19.35%
weekly load shift: -66.81%

Looking at the data this way might be a little big discouraging at first. If we assume a smart applicance can only shift load within a day or less, the resulting storage decreases are very little, saving about half a TWh of storage. Nevertheless, with current technology storage is expensive and not needing 500GWh would mean many pumped hydro stations would not need to be built. In case of very high overproduction, demand response might even reduce the storage need by 10 to 20%.

Conclusions

  • For powering Germany with Wind, Solar and Biomass we need at least 5TWh of storage.
  • To reduce storage need significant over-production is needed
  • The use of li-ion batteries to power the whole system seems very questionable
  • The role of demand response is very limited

This whole notebook can be downloaded here.

Engineering, Politics And How To Save The World

When you ask yourself or others to make a list containing the big problems that mankind is facing, you will probably find these among them:

Note that this is an unordered list, so the position has no specific meaning. Many of these problems are tied very closely together for example: hunger and lack of clean water are often due to poverty which is often caused by the lack of education, terrorism/war and or disasters. However the point of this post is to convince you that most of these problems are technically already solved we only lack the political willpower or solution to implement the solution.

Technically Solved

Lets have a look at the overpopulation and hunger complex. Both seem to be closely linked in peoples minds. We are to many, the world can not feed so many people. At the same time we waste almost as much food in the world as is consumed in Africa (222 million tonnes wasted vs. 230 million tonnes consumed). We do not have a food production issue we have a food distribution issue combined with a quality of production issue in some developing countries. Considering that most of the food is produced and wasted in the developed countries however, mainly a distribution issue. This however means we have technically solved food production. The problem then must be poverty, if the people would have enough money they could buy the food.

So what about poverty?

Poverty is so apparent because of the distribution of wealth, the richest 1% of the people now own about 50% of the world. And the rest of the distribution is similarly unjust. As demonstrated by the hunger problem, it is not really the case that we do not have enough for everybody, we just do not know how to give it to everybody. Our attempts to do so have so far failed and ended in totalitarianism instead of communism. Please note, this is no attempt to make any claims that capitalism is inherently bad. I believe quite the opposite, that is, that capitalism has brought as very far – to where we are now – but we still need to evolve it. Nevertheless, we have plenty of ideas of how to fix the problems we have currently in capitalism. There are proposals to change the current money and banking regime and change taxation in ways to keep the rich from owning 50% of the world. Tackling these fundamentals of capitalism, money and property seems impossible (at least without pitchforks). Yet there are numerous example where it has been done before, our money regime changed last in 1971 due to decisions made by the U.S. government. After it was only introduced in the 1940. An example for seemingly impossible taxation can be found in post war Germany where the actual wealth of a people was taxed. It was officially planed as means of to redistribute wealth. And we are not speaking about small amounts: up to 50% of a persons wealth could be redistributed spread over 30 years. Imagine that. One might think that this was only possible due to Germany‘s isolated position after the war. However the law was based on a Finnish law and Finland was not at all isolated after the war. So again the conclusion could be that we technically know how to solve the problems of capitalism but we just can not implement them politically. Anyhow, wealth distribution is certainly not the only cause of poverty.

What about war and terrorism?

This is one of the things I really struggle with. Is there a technical solution to war? For many cases there actual might be one, however other conflicts seem impossible to resolve. Will the Palestinians stop to hate the Israelis once their economic situation is better? Would the Israelis allow the situation to become better? Will this end the terror? Impossible to answer. We know that there are basically no wars in modern day and age that lead to an economically better situation, so one might assume that there are no wars in capitalism but this is obviously not true. Never the less, the number of people involved in wars is on an historic low (video), so maybe capitalism is also winning on this front. Terrorism however seems to be another shoe. It seems to be the case the the western world constantly looses its battle against terrorism and the more wars we fight the more terrorists we create. And since the modern terrorism is basically founded as an answer against the wars the US and its allies are fighting in the middle east this should not surprise anyone. In other words, terrorism is the evolutionary answer to war. We can not win against it with war. However there are plenty of ideas of how to fight against it, which again we do not implement because we can not bring it on politically. So lets look at some other fields. (Note: I should link to something about this, however I don‘t feel like I have proper sources. A lot of my thinking however is based on ideas from this awesome podcast)

Diseases

There is no doubt that diseases are a problem – admittedly one I do not know much about. I know we have a problem with a shrinking number of effective antibiotics. I have seen how quickly a virus can get out of control (Ebola) and how infectious mutations (SARS/MERS) can be. However we have also seen how quickly we actually can develop a vaccination and discover even new classes of antibiotics or mechanisms of defeating harmful bacteria. So the real question might be why did we not manage to develop these things before a serious crisis was around the corner. The answer is most of the time given in the form of capitalism: it is usually not effective for a company to develop a treatment that heals quickly. If you develop a new antibiotic drug it will be given to the patient for 1-2 weeks an that is it. A vaccine is even worse, a one time shot. If you develop a new pain medication, a new cancer or depression treatment you will likely make profit from the same patient for years. You can just not sell an antibiotic so expansive that it has the same return of investment. So where do you invest your money? This makes the pharmacy industry look like bad people when in fact they are only doing the same as every other business. However we have plenty of ways to influence what the big industries are doing, it all comes down to the right incentives – as it always does in capitalism. You want to keep your patents for your most grossing drug for two years longer? No problem develop something that helps against on of the things on this list we update yearly and you can! Who can implement such a thing? Right, politicians. So what about the other big problem...

Climate Change / Availability Of Energy

This is a problem where we definitely do not have the technical solution yet right? Why in the world would everybody be working on a solutions otherwise? Wrong. I wrote at this at length in a previous post. In review: you could harvest all the energy the world needs in a 500 km square in Africa. One would need to build thermo solar power plants, which would feed the power to methane production plants. The methane production needs CO2 and Water as input. The CO2 can be taken from the air and the water might be gathered through desalinization of ocean water. The compressed methane can then be shipped or pipelined in the world to be used like conventional natural gas. Most of the infrastructure is already there, as are natural gas powered cars, buses, heating systems and power plants. The solar plants, desalination plants and even the methane plants already exist. Just to make this clear, this is not a partial solution. If implemented this will be a CO2 neutral way of supplying the world with easy to store and transport energy until the sun burns out. This could put an end to climate change. At least to further damage. Anyway, it is obviously not about to happen. Instead we have climate conference after climate conference no end insight. We also develop all kinds of fancy plans and complex infrastructure to solve it. So again, the problem is technically solved we just can not implement it politically.

But The Most Important Problem Is … !

I am more or less doing research in the energy sector. Therefore I usually argue like this: Availability of (cheap) energy is the most important problem we need to solve because it will solve all other problems. All we do is consuming energy, all things that make our life easier are consuming energy. We want everyone to have clean drinking water, no problem if we have cheap and "clean" energy we can just build a wastewater treatment plant or a desalination plant. We need more food? No problem we just build a greenhouse, temperature and light controlled and we are good. War? Mostly due to oil nowadays, once we need no oil anymore: gone. Disease? Once people do not need to care about oil and war they have more time to work on disease prevention … and so on. And you will find a lot of other very clever people arguing the same way for energy. Or for war, or poverty, or hunger …  In fact all of these problems are somehow connected, you can not solve one without the other. This does not mean that there is one root problem connecting them, they are all real problems on their own. However the connection between most of them is politics …

So Should We All Become Politicians Then?

Definitely not. While there are some former scientist in politics, some even from natural sciences, I believe not all of us are suited for a job in politics. However most researchers should radically change the view on how to do research. There is one part of science which is tasked with finding out new things about nature, sometimes very fundamental things like the particles that make up the universe, sometimes more about tiny details like how two very specific molecules interact. The another part of science however is tasked with finding solutions, often to the problems discussed here or related ones, or even completely unrelated ones. There might not always be a clear distinction between these roles and the same researcher or group may switch between both of them rapidly. However most of the time it is very clear if the outcome is a solution to a problem or a new fact about "how things work". Now every time you develop a solution to something you have to consider the politics that might be needed to implement your technical solution – because if your solution is political not possible to implement it is just not a solution. For other fields this kind of thinking has become very common, every time a new engineering solution is developed someone will check if it is cost-efficient. From the engineering standpoint this is not necessary if it technically works, the problem is solved right? Except it isn‘t because if it is not a profitable solution for a company it will not be adopted. The same is true if the solution is not feasible in a socio-political sense. Therefore in the same way engineering and many other disciplines have adopted economic theory we need to adopt socio-political thinking to test if our solutions are actual solutions to a problem not just technical ones. In many ways this means to just adopt more from economic theory than just cost calculations, because at the core economics deals with the incentives people have for making their decisions, it just happens to be the case that incentives often come in the form of money. Nevertheless incentives and rules are what politicians can use to make a difference, however very few technical solutions we have come with a bundle of incentives and rules that need to be in place in order for the solution to work right.

Examples?

To give a more concrete example, we just saw the introduction of distributed energy storage for the mass market. However the battery technology is not yet cheap enough or good enough to go off grid. But since we have a lot of solar and wind energy in certain countries, resulting in high price fluctuations for power, these batteries start to make economic sense in a way that they can be cost effective. Which is why we will most probably see them adopted in many places. Once we have enough batteries they will however begin to influence the price of electricity, because they dampen the price fluctuation we currently see, by buying power when it is cheap and selling it when it is expensive. Which means once we have enough batteries the fluctuations will reduce considerably if not vanish, which is very beneficial for society because it means energy is always available in enough magnitude. We have to remember however that these very fluctuations are what made the batteries worth buying in the first place. Economic theory now suggest that people will stop buying batteries because it is no longer profitable. The problem however is that the cost effectiveness of the batteries was calculated over many years, so once at the point that the price fluctuations begin to shrink, it is already to late for all the buyers of batteries. Economic theory again suggest that we all try to optimize our profit, how could you do that if you have bought a battery? Fairly easy, you just try to sell as late as possible when the price starts to rise, because as long as no one is selling the price will continue to rise. So there is now an incentive and a possibility in place for all the battery owners to increase the fluctuations instead of decreasing them. There are several reasons why you can not play this waiting game indefinitely, first of all at some point the grid will have a blackout. Second, the regulated power plants will kick in and supply the power needed. Third, if enough of the other players sell before you, you will not make your needed profit. While the third reason might keep the whole situation in check, by keeping everyone on its toes while waiting, it does by no means guarantee stability. Because now everyone is looking for a change in the speed of the rising price, because a slower rising price suggest the others have begun to sell. So now a slowdown might trigger an avalanche of sales, flooding the market. So instead what we need is a regulations that makes it very unlikely or downright impossible for the owners of batteries to engage in this kind of speculation, while still giving them an incentive to buy a battery helping to stabilize the power grid. It is exactly this kind of political solution that is needed for the technologies to succeed and be of value for all of society. We engineers are problem solvers, however we leave some of the toughest problems to figure out for the politicians – even though we know they fail to solve them a lot of the times. This has to change.

 page 1 / 2  older